
The picture is explaining the difference between people that make the web and make it work and people that design the websites and make everything look nice.

I got this picture from google.
This picture is explaining the process of an infographics being made.
I got this picture from creativemarket.com
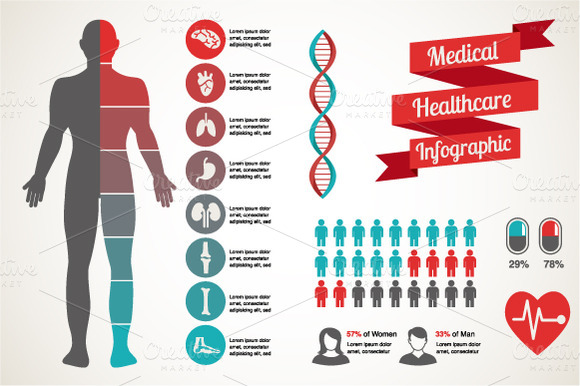
This pictur is explaining everybody part, its functions, and everything that lies under that body part including internal organs.

I got this picture from www.shape.com
T